I wrote a few weeks ago about a seminar at Bath given by Professor John Loughhead, chief scientific advisor to DECC. His powerpoint slides are now available on the I-SEE website. In what I wrote, I singled out a particular graph, and here it is – although with much lower resolution that I'd have liked:
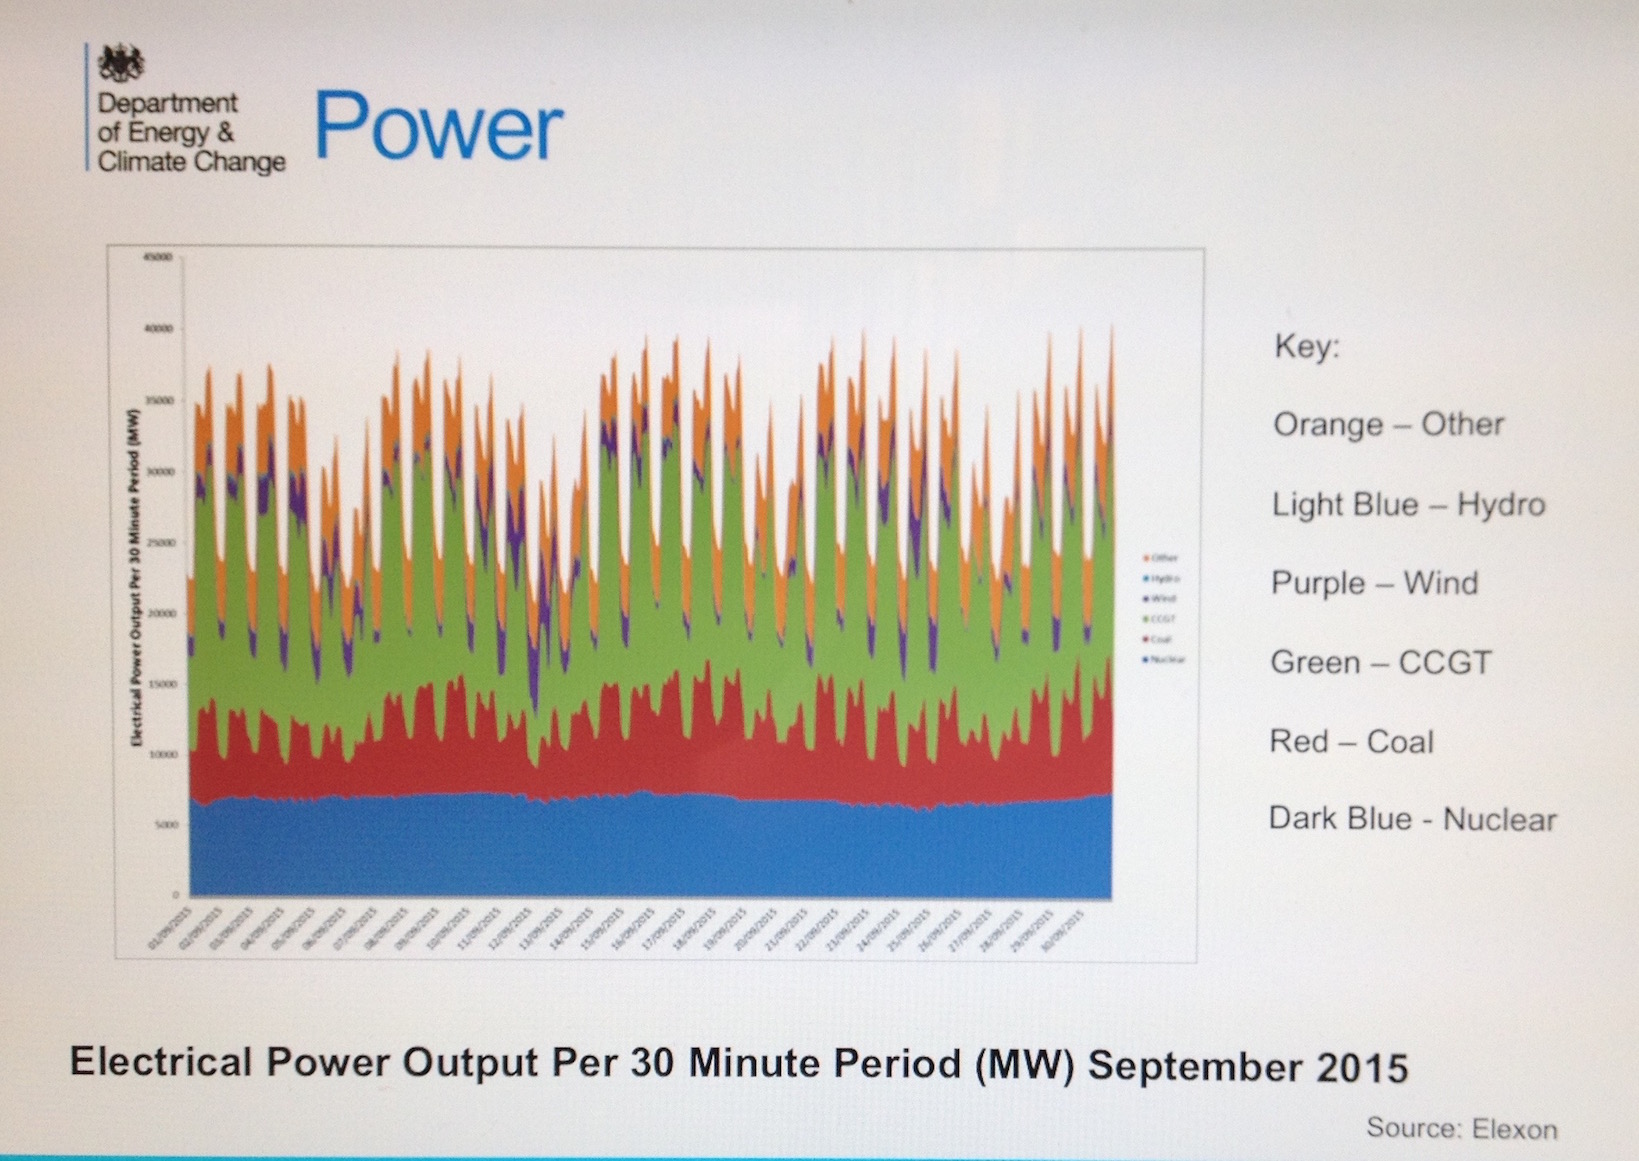
This is the most sobering graph I have seen for a while. It shows the UK's September 2015 electricity generation data (x-axis is days; y-axis is power).
The day/night fluctuation is clear; as is the weekend lull. You can see that the baseload is over 50% of the peak demand, and that the vast majority of this is provided by nuclear (blue), coal (red) and gas (green).
Given that we (unlike the supposedly virtuous Germans) are rapidly phasing out coal, and not replacing our ageing nuclear plants any time soon, it's clear that the baseload will be mostly gas in the immediate future. But how are we to meet our carbon targets while doing this? How indeed?
Does anyone at DECC know?
Responses
Some graphics from the US, which capacity is still overwhelmingly carbon-intensive (we're flooded with natural gas right now because of fracking) and likely will be for the next few decades:
https://www.washingtonpost.com/graphics/national/power-plants/
I wish more pro-renewable folks would acknowledge the reality of this situation: that getting to full replacement absent some sort of massive reduction in consumption isn't feasible in the foreseeable future. And those projects are increasingly controversial too, as they require more spatial distribution and thus, more NIMBYism:
http://vtdigger.org/fullimagestory/special-report-rural-communities-push-back-against-solar/