Joe Chrisp is a PhD candidate in the Department of Social and Policy Sciences and Institute for Policy Research (IPR) at the University of Bath.
Nick Pearce is Professor in Public Policy and Director of the IPR at the University of Bath.
The impact of age on voting behaviour and political outcomes has become an issue of increasing interest, particularly in the UK. The 2017 general election saw an unprecedented demographic division in the electorate between old and young: exit polls and post-election surveys suggested that between 55% and 58% of over 65s voted for the Conservative Party, while between 57% and 62% of the under-35s voted for the Labour Party. Similar age divisions marked voters’ preferences for Leave or Remain in the 2016 Brexit referendum: older voters delivered the narrow majority to ‘Leave’ the EU against the preference to ‘Remain’ of most younger voters. New YouGov data suggests that the Brexit Party is picking up most of its support from older, Leave voters – a finding that would be unsurprising to anyone who has seen images of Nigel Farage’s recent rallies.
The UK has particularly stark differences in voter turnout by age. Older age groups are much more likely to vote than younger people, and as older people become a larger proportion of the population, this age divide may assume even greater significance: the relative weight of older age groups in the electorate is likely to incentivise political actors to respond to their preferences and make it hard to form a governing coalition without their support. Some commentators have speculated that ‘age is the new class’ in British politics, as the polarisation of voting by age has appeared to coincide with decreased polarisation by social class.
Torsten Bell and Laura Gardiner explore these issues in a new Political Quarterly special edition, Britain Beyond Brexit (Bell and Gardiner, 2019) and in this blog, we set out some recent material from the early stages of our own research into the rise of the grey vote, with similar findings to theirs. There has been a lot of attention to the so-called ‘youthquake’ of the 2017 General Election, and whether there was an increase in turnout by young people that drove support for Jeremy Corbyn (Prosser et al, 2018). Here we frame the age divide slightly differently and consider the rising importance of older voters in British politics. In future work, we will turn our attention to some of central drivers of the age divide.
The rise of the 'grey vote'
In common with most other developed countries, the population of the UK is ageing as a result of increased life expectancy and differential birth rates among generations, principally the demographic bulge caused by the so-called ‘baby boomer’ generation. As this generation has begun to pass retirement age, the dependency ratio has started to rise quite significantly. Using Office for National Statistics (ONS) population estimates for the UK by age, we can see the scale of the change between 1971 and 2017, and projections for the period between 2017 and 2050 (Figure 1). The proportion of the adult population over 65 has increased from 18.5% in 1971 to 23.2% in 2017. Meanwhile, the proportion of those over 55 has increased from 34.9% to 38%. The dotted lines in Figure 1 show these proportions projected up to 2050. Over 55s are projected to constitute 46.2% of the population in 2050, and over 65s, 37.1%. These long-term projections show that even once the baby boomer generation has mostly passed away, increased life expectancy will make the UK a permanently older society.

Although this demographic change is in itself striking, it underestimates the relative size of older people in the eligible voting population. This is because, although inward migration to the UK in recent years has increased the size of younger age groups, under existing electoral rules only British, Irish and Commonwealth citizens can vote in UK parliamentary elections while much of the recent immigration to the UK has been from the European Union[i]. This has opened up a wide gap between the Voting Age Population (VAP) and the Voting Eligible Population (VEP). Recent analysis by Mellon et al suggests that in the UK, the VAP-VEP gap steadily increased from 2005 to 2017, from 1.7 (2001/2005) to 5.6 (2016/2017) percentage points, mostly due to EU migration (Mellon et al, 2018).
Using quarterly Labour Force Survey (LFS) data from April-June 2017, we estimate the proportion of residents eligible to vote (i.e. those with British, Irish or Commonwealth nationality) by age group:

Table 1 shows that the highest rates of eligibility to vote due to nationality are found amongst older voters. Thus, over 55s go from 38% of the resident adult population to 39.9% of the electorate and over 65s from 23% to 24.5%. This can be compared to quarterly Labour Force Survey data from April-June 1992 when residents ineligible to vote were a very small proportion of all age groups.

Age divides in political participation
The growing relative weight of older people in the voting-age population is coupled with considerable inequalities in voter turnout according to age. Using British Electoral Study (BES) face-to-face post-election survey data, Clarke et al. (2004) showed that, although the youngest age group (18-34s in their analysis) have had a lower propensity to vote since the 1970s, significant inequalities in voter turnout among different age groups only developed after the 1992 general election. In Figure 2, we replicate this analysis using the same data, weighting for the official reported turnout rate in each year. The analysis shows that the large age differences in turnout that opened up in the 1990s have persisted in recent general elections.

In 2017, our analysis of the BES data suggests that turnout among over 55s was 83.35%, compared to 58.15% of those under 55. Likewise, turnout was 84.34% vs. 63.06% for over and under 65s respectively. Combining these BES estimates of turnout with LFS estimates of nationality and ONS population estimates, we arrive at the following figures: the over 55s constituted 48.35% of the voting public in 2017, and the over 65s, 30.27%. If we assume that both turnout and the proportion of those disenfranchised due to their nationality remain constant, over 55s will constitute over half of the voting public by 2020 as a result of projected demographic change.
Using ONS and National Records of Scotland (NRS) population estimates by age for parliamentary constituencies in England, Wales and Scotland, we also find a weak positive relationship between the age of constituencies and the official constituency-level turnout figures at the 2017 general election.

However, overall levels of non-participation of voters in elections consist of both failure to turnout and failure to register. Official turnout figures only measure the proportion of the registered electorate that votes on polling day; this does not include those that are not registered to vote. Thus, we also calculate the constituency ‘registration rate’ by dividing the numbers on the electoral register by the estimated constituency population. Although this is a poor proxy for the actual levels of registration, at the constituency level the measure can indicate the proportion of residents who do not vote due to both ineligibility and non-registration.

As Figure 4 shows, there is a much stronger relationship between registration rates and the proportion of over 55s in a constituency than between the age of the constituency and turnout.
Age divides in political choice
The fact that over 55s may constitute more than half of the voting public by 2020 should endow them with considerable electoral influence. Yet the power of older voters is only likely to be significant if their preferences and vote choices differ substantially from the rest of the electorate. Recent evidence suggests this is indeed the case. In both the Brexit referendum and the 2017 general election, there were very considerable differences in voting according to age. Using BES post-election data from 2017, Tables 3 and 4 show how each age group voted in the Brexit referendum and the 2017 general election respectively.


This age divide was also reflected in the seats that parties won at the 2017 general election. Once again, using ONS and National Records of Scotland (NRS) population estimates by age for parliamentary constituencies in England, Wales and Scotland, Figure 5 shows the average median age of the adult population for constituencies won by the major parties. The constituencies that Labour won were on average considerably younger than Conservative seats, with a median age of 44.9 vis-à-vis the Conservatives with 50.4.

The geography of the age divide is also particularly striking. We divide the 632 constituencies in Great Britain (i.e. the UK excluding Northern Ireland) into three roughly equal categories based on the median age of the adult population in 2017: young, middle-aged and old. “Young” is operationalised as a constituency with a median age between 28 and 47, “middle-aged” between 48 and 50 and “old” between 51 and 59. Table 5 shows the distribution of these constituencies according to whether they voted Conservative or Labour[ii]. Both the Conservatives and Labour get more than half of their seats from constituencies that are in the older or younger third respectively.

However, it is not only the age but also the geographical location of these constituencies that is striking. As Figure 6 shows, young Labour voting constituencies are virtually all clustered around the major urban centres such as London, Birmingham, Leeds and Bristol. Meanwhile, old Conservative voting constituencies are all over the country in less densely populated areas.

To what extent is this divide in voting preferences according to age a recent phenomenon? We trace voting patterns back to 1970 using the archive of BES post-election cross-sectional surveys. As Figure 7 shows, the Conservative Party has always received greater support from older people, with a particularly large age divide opening up in 1997.
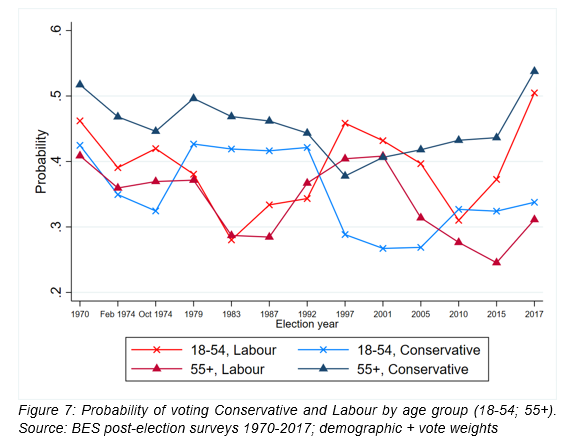
Although Labour’s constituency appears to be more evenly distributed across age groups, a more consistent age cleavage shows up when we think of Labour, the Liberal Democrats and the Greens as a left-of-centre bloc, and the Conservative and UKIP as a right-of-centre bloc. Broadly speaking, younger people are more likely to vote for the Greens or the Liberal Democrats and their predecessors. The fact that older people are more likely to vote UKIP also further widens the age divide if we add these to Conservative vote bloc.

This analysis also shows that the 2017 general election was the most polarised by age since 1970, whether we look at only the Conservative and Labour vote shares, or at left-right blocs. To understand this sharpening of the age divide in the 2017 general election, we can focus on the BES Internet Panel data from 2014-2018. As we are not tracking individual-level change in voting intention, we treat each wave as a cross-section. Thus, each wave contains a sample of more than 27,000 respondents and is weighted by specific weights for each wave (see Table A1 for description of the dates and political significance of each wave).
Figure 9 shows the probability of intending to vote Conservative by age group (indexed to February 2014) across the 14 waves collected in the panel. Individuals without a voting intention are excluded to make election waves and non-election waves more comparable. The data shows that between February 2014 (Wave 1) and the post-general election survey in May 2015 (Wave 6), there was a slight increase in polarisation by age group. All age groups became more likely to vote Conservative but the increase was largest among over 65s, followed by 50-64 year olds.

The age divide in political preferences then sharpens considerably in Wave 9, precisely after the 23rd June 2016 Brexit referendum vote. The probability of voting Conservative rises for all groups between Wave 9 and Wave 11, but does so much more significantly for the 50-64s and the over 65s. There is then a shallow drop off in support for the Conservatives after the start of the 2017 general election and in the months that follow.
The European Parliamentary elections taking place at the end of May 2019 will result in a considerable fracturing of the vote shares of the both the Conservative and Labour parties, as they shed support to the Brexit Party, the Liberal Democrats and the Green Party. But if recent trends in the evolution of the age divide in British politics are anything to go by, the voting blocs of young/middle aged versus older voters will likely persist underneath the headline shares going to the different political parties. Whether this age divide can be explained by a ‘cultural backlash’ of older voters against progressive liberalism or by the different relationship of young and old to the economic geography of the knowledge economy is an issue we will explore in a forthcoming article.

References
Bell, T. and Gardiner, L. (2019) My Generation, Baby: The Politics of Age in Britain in G Kelly and N Pearce (eds) Britain Beyond Brexit, The Political Quarterly. Vol 90, Issue 2, pp. 105-16.
Clarke, H., Sanders, D., Stewart, M., and Whiteley, P. (2004) Political Choice in Britain. Oxford University Press.
Mellon, J., Evans, G., Fieldhouse, E. A., Green, J., and Prosser, C. (2018) Aggregate Turnout is Mismeasured.
Prosser, C. Fieldhouse, E. A., Green, J., Mellon, J., and Evans, G. (2018) Tremors But No Youthquake: Measuring Changes in the Age and Turnout Gradients at the 2015 and 2017 British General Elections.
[i] UK residents over the age of 18 (except prisoners or members of the House of Lords) who are citizens of the Republic of Ireland, Malta and Cyprus can votes in UK Parliamentary elections, but not other EU citizens. The same eligibility rules that apply to UK Parliamentary elections were used for the Brexit referendum (with the addition of residents of Gilbraltar) but not the referendum on Scottish independence, in which EU citizens and 16 and 17 year olds were entitled to vote. EU citizens can vote in local government and European Parliament elections.
[ii] All constituencies won by a different party denoted as Other.