
Dr Matt Dickson is Reader in Public Policy at the Institute for Policy Research (IPR), University of Bath.
The number of people undertaking postgraduate degrees has grown rapidly over the last 20 years, with more than 350,000 students starting a postgraduate course in the UK each year, double the figure from the end of the 1990s.
But who are the students who progress beyond an undergraduate degree onto a postgraduate course? And how does background influence the likelihood of progression and the particular route taken? These are questions that we answer in our latest report for the Department for Education, using the vast Longitudinal Education Outcomes (LEO) dataset.
The growth in the postgraduate degree market is likely to in part be a response to the growth in the number of young people who go to university and attain an undergraduate degree – this has grown from under 40% of each cohort at the turn of the millennium to 50% in the latest data. In a crowded graduate labour market, young people may decide that to distinguish themselves and signal their higher ability to potential employers, a masters degree is a worthwhile investment.
Unlike for undergraduate courses, tuition fees for postgraduate degrees are not regulated by the government, though at around £8,000 for a domestic student, the average cost for a one-year masters at a UK university is cheaper than most undergraduate courses. There is a large range however - an MSc in Finance from the London School of Economics (LSE) will set you back £37,000 in tuition fees, for instance.
Loans are now available to cover postgraduate fees, however the maximum loan is around £11,000 (it varies slightly depending on which part of the UK you are from), which will not get close to covering the fees for many courses. For example, there is not a single postgraduate course at LSE that would be covered by the maximum loan, and for Economics masters (which we show have some of the highest returns for men and women) the current fees at a selection of the top-rated Economics departments are: UCL (£22,000), LSE (£29,000), Warwick (£24,000).[1]
These courses have high returns, and so there is an obvious social mobility concern if the fees are prohibitively expensive, even with a fee loan. Moreover, the reduction in income owing to an additional year out of the labour market, plus living costs on top of tuition fees, potentially makes it an even more prohibitive proposition for students from lower-income backgrounds, even for courses that the fee loan would cover. And in the period that our LEO data covers, there were no fee loans available at all, with students required to self-fund or seek a studentship from a research council - another organisation offering funding or bursaries from Higher Education Institutions (HEIs) themselves.
As such, it is important to investigate whether there are differences in participation in postgraduate courses depending on background, which would indicate possible financial constraints. There are also important policy implications, should social mobility be hindered by the market for postgraduate degrees.
So what do we find?
Women are more likely to take postgraduate degrees than men, though much of this difference is explained by the greater likelihood of doing a teacher training degree (PGCE). The proportions of men and women going on to masters and PhDs is very similar as Table 1 shows.
Table 1 – Continuation to postgraduate study by gender and undergraduate degree characteristics
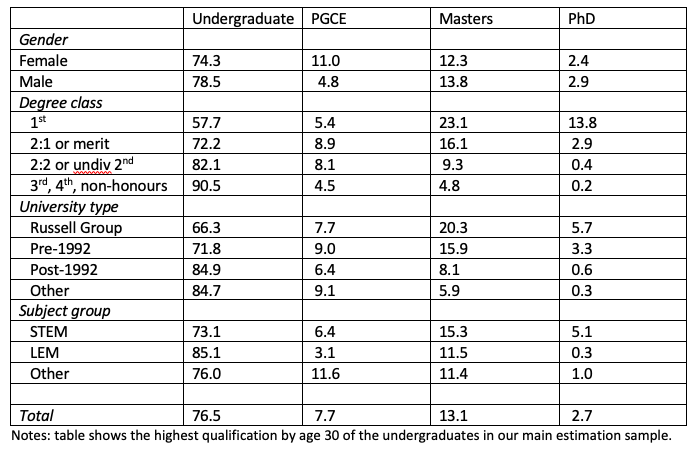
In terms of who progresses based on their undergraduate degree characteristics, there are some very clear patterns. Getting a 1st or a 2:1 makes it much more likely that a graduate will go on to do a PhD, very few of the graduates with a 2:2 or below continue to PhD, and indeed less than 10% of those with a 2:2, and less than 5% of those with a classification below that, go on to even a masters.
With regard to the type of institution, undergraduates from Russell Group and pre-1992 HEIs are much more likely to go on to a masters and even more so with regard to PhD study. One-in-four graduates of Russell Group universities go on to get a masters or PhD, while it is around one-in-twelve for post-1992 institutions.
As we might expect, subject-wise it is graduates from STEM undergraduate courses that progress to masters (15%) and PhDs (5%) most, with law, economics and management (LEM), and graduates of all other courses, equally likely (11%) to go on to a masters. There is a clear difference in who goes on to PGCSE however, with few LEM graduates taking this route (3%) but many graduates of other non-STEM or LEM courses (12%).
How important is family background?
As with access to undergraduate degrees, there is a steep social gradient in raw participation rates for postgraduate degrees. But as the statistics from Table 1 show, there are large differences in access according to attainment and university type. So any social gradients in these will translate through to create the raw difference in postgraduate degree access that we see in the first bar of Figure 1. However, taking account of differences in prior attainment has a dramatic effect on this gap.
Figure 1 – Gap in postgraduate participation, bottom vs top 20% of socio-economic status
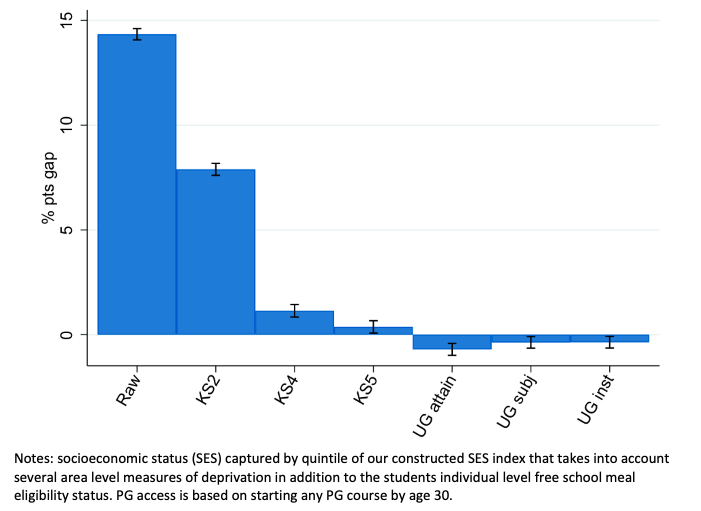
The raw gap in participation is just under 15 percentage points (ppts), comparing those coming from the most well-off 20% of households with those from the least well-off 20%. Around one-in-five students from the top quintile go on to postgraduate study, whereas it is only one-in-twenty amongst those from the lowest socioeconomic status (SES) quintile.
However, the successive bars on the chart show the impact of taking into account prior attainment in school and higher education (HE). Adding in attainment at age 11 (KS2) reduces the gap to around seven ppts, then adding attainment at age 16 (KS4) and age 18 (KS5) reduces the gap further still, to below one ppt. So, comparing individuals from the most and least well-off families, who had comparable attainment at GCSE and A-level, there is almost no gap in postgraduate participation. When we go on to add-in undergraduate attainment, subject and institution, the gap becomes negative – that is, graduates from the least well-off families are more likely to progress to postgraduate study than those who get the same attainment from the best-off families.
This is encouraging as it suggests that at a time when there were no loans to cover postgraduate tuition fees or living costs, graduates from poorer families were not excluded from the market by financial constraints. It does though point to issues earlier on in the system – attainment at ages 11 and 16 almost totally explain the raw postgraduate participation gap between individuals from the better and worse-off families. To get more young people from the least well-off families onto postgraduate courses will require more getting the grades (particularly at GCSE) to get onto an undergraduate course in the first place.
Moreover, digging deeper we see that there is a notable difference in the type of postgraduate course that graduates from different family backgrounds undertake.
As shown in Table 1, degree class, HEI type and subject of undergraduate degree all have a bearing not only on likelihood of progression to postgraduate study but also on the type of course too. So SES differences in these factors will influence the routes graduates take. This is reflected in Figure 2. We see that for masters/PhD participation (right-hand chart), the picture very much reflects the aggregate findings in Figure 1. While in the raw data, those from the better-off families are around 12 ppts more likely to progress to masters/PhD. Once we condition on school and HE attainment there is essentially no difference in progression rates – the raw gap is all explained by prior attainment.
Figure 2 – Gap in postgraduate participation, bottom vs top 20% of socio-economic status, PGCE (left), masters/PhD (right)
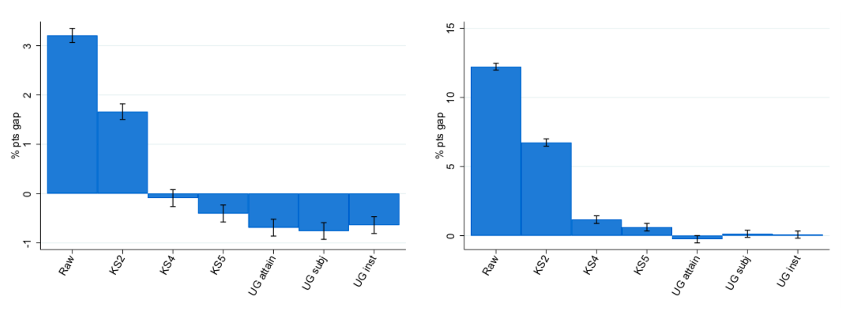
However, for PGCE, an initial raw gap of three ppts becomes a small negative gap once we take account of attainment up to A-level. And when we add in attainment, subject and institution at undergraduate level, this negative gap increases further to about half a percentage point. This tells us that graduates from poorer families are more likely than their equally attaining, but better off peers, to choose to continue on to a PGCE course.
We show in the report that average wages at age 35 for those who get a PGCE are lower than for those who just have an undergraduate degree. For men a whopping £13,000 per annum lower, for women just under £4,000 p.a. lower. However, median earnings of PGCE graduates are slightly higher than for the median undergraduate for women, and for men it’s only slightly lower, indicating that PGCEs compress the earnings distribution – removing the chance of very high or low earnings. And once we control for the types of graduate who go onto a PGCE, comparing those with PGCEs with similar individuals who just get an undergraduate degree, we find very small positive (1%) average returns for women and small negative (-2%) average returns for men.
What does all this tell us?
It tells us that graduates from undergraduate degree courses who have low earning prospects are more likely to take the PGCE, and end up earning little different to their peers who just have the undergraduate degree. But while average earnings are the same, the PGCE reduces the variation in earnings outcomes and also increases employment prospects. In short, it’s a safe bet.
This isn’t a bad thing but combined with the access results in Figure 2, it suggests that graduates from poorer families are more likely to be taking a safe option, removing the chance of securing a very high paying job. This has obvious consequences for social mobility if more of those from poorer backgrounds are excluding themselves from the possibility of the highest paying jobs, and may perhaps reflect differences in attitude towards the student debts that all now graduate with (a feeling it’s better to have a steady job and pay it off than risk having the debt for longer?).
For those involved with widening participation in HE there are a number of lessons. Firstly, there’s still work to be done to close the gap in undergraduate entry, as this is obviously a prerequisite for postgraduate study. We show in the report an undergraduate participation gap between the top and bottom 20% of the SES index of three ppts even after taking account of prior attainment up to age 18, so there is more that could be done to promote access for young people from lower income families.
Over and above this however, attainment at 16, and attainment at 11, are the big factors influencing the participation gap between the best-off and worst-off families at undergraduate and postgraduate level. Improving attainment by these key points in the education journey would go a long way to wiping out the inequalities in HE participation.
Specifically for postgraduate study, the findings here give us food for thought. There are legitimate reasons why greater numbers of lower SES graduates would choose the PGCE route – people care about employment security and earnings predictability, not just earnings levels. However, HE will not provide the boost to social mobility that it might if graduates from poorer backgrounds consistently choose lower risk, lower reward paths. Understanding the barriers that make the more lucrative alternative paths appear too risky needs to be a priority for research in this area.
[1] In the most recent Research Excellence Framework (2014) for Economics and Econometrics UCL were ranked 1st, LSE 2nd and Warwick 5th. 3rd and 4th were Oxford and Cambridge who offer a 2-year MPhil and so are not included in the fees comparison. Fees taken from the respective university websites.
Read Dr Matt Dickson’s previous blog, ‘Postgraduate degrees: What are the returns to them and how do they vary?’.
This blog is based on a new report from the Department for Education, co-authored by Dr Matt Dickson, Jack Britton, Professor Franz Buscha, Laura van der Erve, Professor Anna Vignoles, Professor Ian Walker, Ben Waltmann and Yu Zhu. Read the full report here.
All articles posted on this blog give the views of the author(s), and not the position of the IPR, nor of the University of Bath.
Respond