![]()
Welcome to our short blog series as we highlight learning activities and technologies you want to know more about. This month we'll tell you about...
Learning analytics
 ‘Learning analytics refers to the measurement, collection, analysis and reporting of data about the progress of learners and the contexts in which learning takes place’ (JISC, 2016)
When students complete online learning activities, they leave a ‘digital footprint’: for example when they read an e-journal in the library catalogue, or complete a quiz in the Moodle Virtual Learning Environment. Learning analytics allows you to analyse this data. It can include tools to help you visualise the information.
Currently, you can use Moodle Reports as a simple way to access learner data that can help you understand student progress.
 Staff can use learner data to help identify students who are not engaging with learning materials at the early stages of their studies. You could also use data to help you set up personalised learning activities in the online environment. So you could use learning analytics to discover key concepts which students find difficult, then set up a quiz. Depending on the outcome of the quiz, the student can be directed to further resources, or to extra material to support key concepts.
Some HE institutions are developing dashboard systems to visualise data from different sources. They are considering how the data can help students actively engage in reflection.
Other institutions use reporting tools to track how students use digital resources. For example, at the University of Cardiff staff use Eesysoft reporting to monitor the use of digital resources. They can then create tailored support material and provide it at the point of need.
 Be clear about the purpose of learning analytics in your context. Is it to help improve quality or a way of offering tailored, personalised feedback to a group of students?
Consider the key stages and activities in your course from the student perspective: induction, access to key resources, preparing coursework assessment and revision for exams, for example. At each stage, you could identify the key online materials and activities, and access the Moodle reports to check on student progress. You can use this information to send out personalised hints and reminders to encourage student engagement.
Think about how you plan to use the data, and make sure it complies with GDPR requirements. It may also be helpful to inform students of how you plan to use Moodle reports.
 The JISC Learning Analytics Network provides current information on the strategic use of learning analytics.
This report from the Higher Education Commission provides insight into the emerging use of learning analytics in the HE sector http://www.policyconnect.org.uk/hec/research/report-bricks-clicks-potential-data-and-analytics-higher-education
For an example of institutional policy for learning analytics, the University of Edinburgh have created a principles and purposes document https://www.ed.ac.uk/academic-services/projects/learning-analytics-policy
The JISC Analytics Lab (aka Heidi Lab) project has been working on producing dashboards to enable easier interpretation and interrogation of data through data visualisation techniques. Only peer reviewed and data of a good standard is added to the system. So far it has focused on institutional reporting, but learning data dashboards could be developed in future.
 You can currently access the Moodle Logs or Course Participation reports to review student activity.
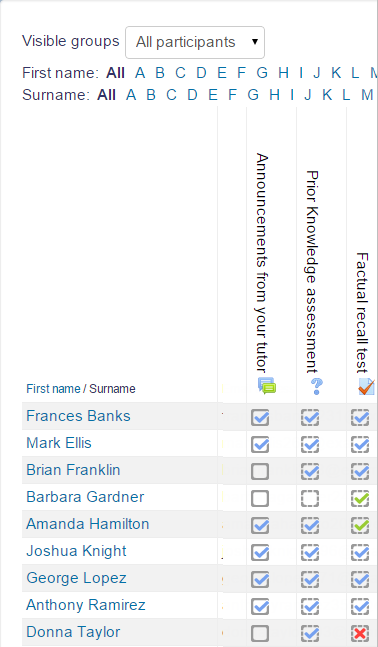 If you enable Course completion in your course settings, you can also choose to enable Activity completion for each activity. You can then use the Activity Completion report to monitor student progress throughout the course.
These simple reports can help you to monitor student progress, provide personalised feedback and reminders, and improve the design of your course.
Don't forget you can get in touch contact with your Faculty Learning Technologist to identify the best options for your context: fed-tel@bath.ac.uk