Professor Roger Farmer is Distinguished Professor of Economics at the University of California, Los Angeles (UCLA) and Research Director at the National Institute for Economic and Social Research (NIESR).
The Chancellor of the Exchequer, Philip Hammond, will present his Autumn Statement to Parliament on Wednesday. In the heated debate over austerity, this piece offers three facts about debt and deficits which, I hope, will help shed light on the issues he will face.
Fact Number 1: UK Public Sector Debt is Not Large
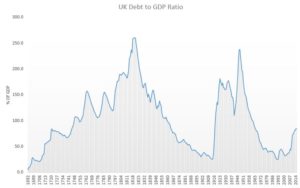
The UK public debt is equal to £1.7 trillion and it is increasing at a rate of £5,170 per second (National Debt Clock UK). But although government debt is increasing at a rapid rate, that fact does not pose a threat to the solvency of the UK Treasury. Government debt should not be measured in pounds; it should be measured in GDPs. When GDP is high, so are tax revenues, and so is the ability of the government to repay.
Chart 1 shows the ratio of government debt to GDP for every year beginning in 1692. Notably, this ratio has been as high as 250% – during the Napoleonic War – and almost as high again at the end of WWII.

Fact Number 2: Governments Do Not Repay Debt: They Grow Out of It
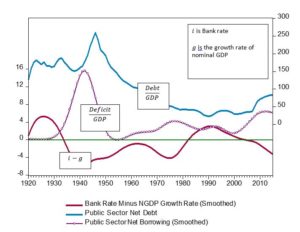
Chart 2 reproduces the debt-to-GDP ratio from Chart 1, but the time scale is limited to the years from 1920 to 2015. Public sector debt is the upper solid line, measured on the right scale as a percentage of GDP. The line marked by circles, measured on the left scale, also as a percentage of GDP, is the value of the public sector deficit, smoothed by averaging adjacent values. A positive number indicates that the public sector spent more than it received in revenue.
On average, the public sector borrowed more in every year from 1920 to 2015. Nevertheless, the debt-to-GDP ratio fell continuously from the end of WWII to the early noughties. The public sector borrowed more – but its debt, properly measured, fell.

George Osborne, former Chancellor of the Exchequer, planned to bring the government budget into surplus by the year 2020. That plan represented a break from UK post-WWII policy. A surplus of public sector borrowing is neither necessary nor sufficient to reduce government debt when debt is measured as a fraction of the government’s ability to repay.
Fact Number 3: Government Debt Should Not Be Zero. Ever!
Nation states borrow to provide public capital: rail networks, road systems, airports and bridges, for example. These are examples of large-expenditure items that are more efficiently provided by government than by private companies.
The benefits of public capital expenditures are enjoyed not only by the current generation of people, who must sacrifice consumption to pay for them, but also by future generations who will travel on the rail networks, drive on the roads, fly to and from the airports and drive over the bridges that were built by previous generations. Interest on the government debt is a payment from current taxpayers, who enjoy the fruits of public capital, to past generations, who sacrificed consumption to provide that capital.
To maintain the roads, railways, airports and bridges, the government must continue to invest in public infrastructure. And public investment should be financed by borrowing, not from current tax revenues.
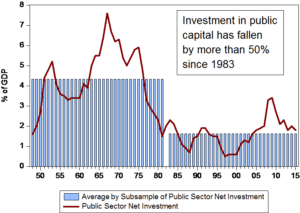
Chart 3 shows that investment in public infrastructure was, on average, equal to 4.3% of GDP in the period from 1948 through 1983. It has since fallen to 1.6% of GDP. There is a strong case to be made for increasing investment in public infrastructure. First, the public capital that was constructed in the post WWII period must be maintained in order to allow the private sector to function effectively. Second, there is a strong case for the construction of new public infrastructure to promote and facilitate future private sector growth.

The debt raised by a private sector company should be strictly less than the value of assets, broadly defined. That principle does not apply to a nation state. Even if government provided no capital services, the value of its assets or liabilities should not be zero except by chance.
National treasuries have the power to transfer resources from one generation to another. By buying and selling assets in the private markets, government creates opportunities for those of us alive today to transfer resources to or from those who are yet to be born. If government issues less debt than the value of public capital, there will be an implicit transfer from current to future generations. If it owns more debt, the implicit transfer is in the other direction.
The optimal value of debt, relative to public capital, is a political decision. Public economics suggests that the welfare of the average citizen will be greatest when the growth rate is equal to the interest rate. Economists call that principle the golden rule. Democratic societies may, or may not, choose to follow the golden rule. Whatever principle the government does choose to fund its expenditure, the optimal value of public sector borrowing will not be zero, except by chance.
Recommendations for the Autumn Statement
What can we learn from these three facts and what should we look for in the Autumn statement?
We should not be too concerned about a debt to GDP level approaching 100%. We have been there before and we will go there again. We should be concerned that public spending has shifted away from investment on the capital account and towards the current account.
Economics has the reputation of being the dismal science. It is a dismal reality that there are diminishing returns to the prolongation of life. As we invest an increasing share of resources into advanced drugs and new treatments, the additional benefits, measured in extra weeks of life, will shrink.
As the population ages and life expectancy increases there will be an increasing burden on pensions and the National Health Service. These expenditures are predictable and can be planned for by stabilising the deficit on the current account either through limits on expenditures or through increased taxes. Our politicians must choose how much, as a society, we spend on health. And this choice must be presented to the electorate.
Capital account expenditures should be separated from the current account and increased back to 1960s levels. Work by Paul Romer, the new Chief Economist of the World Bank, suggests that these expenditures have the potential to pay for themselves. He advocates the creation of new charter cities and the expansion of existing cities. The last coalition government’s proposal to create a ‘Northern Powerhouse’ is an example of an investment of this kind.
There are also strong economic arguments to consider education expenditures at all levels – primary, secondary and tertiary – to be a capital expenditure. Education is an investment in the British people from which we all gain. But as with all capital expenditures, investment in education should be targeted towards the areas that have the highest potential for social impact.
On November 22, Professor Farmer will speak at an IPR public lecture entitled Prosperity for All: How to Prevent Financial Crises.
This post originally appeared on the NIESR blog.
Respond


