Rosalind Shorrocks is Teaching Fellow in Quantitative Political Science at the University of Bath's Department of Politics, Languages and International Studies.
The Fawcett Society recently published analysis in which it claimed that there would be a ‘missing eight million’ women in the 2017 general election. To support this, they argue that 2.5% points fewer women than men say they are certain to vote in the election, and 2.5% points fewer women than men say they are registered to vote. If women were to vote in substantially lower numbers than men, this would lead to serious concerns about the representation of women in our political system, as well as raise questions as to why our political parties are putting off women.
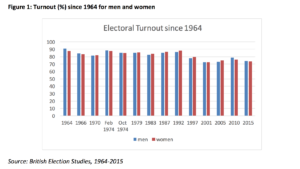
However, it would be surprising if women did, in fact, vote in substantially lower numbers than men on 8 June. The British Election Study, the highest quality post-election survey data available, shows us that in most elections women and men have voted at roughly similar rates. In fact, we have to go back to 1964 to find a statistically significant gender difference in turnout, and even then women were only 3% points less likely to vote then men. There is no reason to expect this pattern to be different in this year’s election.
So, are there any significant differences in voting behaviour between men and women in 2017? Most opinion polls conducted since the general election was called indicate small to modest gender differences in vote intention, with more men than women supporting the Conservatives, and (slightly) more women supporting Labour. Most polls also show men intending to vote for the Liberal Democrats in greater numbers than women, although the numbers are small. Data from YouGov and Panelbase highlight the age dimension in these gender differences. They show that women are more supportive of Labour than men in younger age groups, but more supportive of the Conservatives than men in older age groups. Age differences in the gender gap have been well-studied in the academic literature (see here and here).
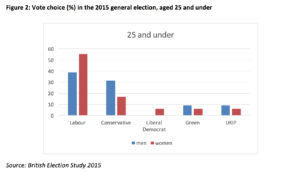
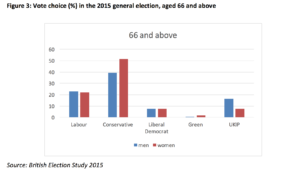
However, the 2015 general election was the first election where we saw this specific age-by-gender pattern in Britain. The figures below show the distribution of votes by gender for those aged 25 and under, and 66 and over, in 2015. The well-known age dynamics are visible, with younger voters more supportive of Labour, and older voters more supportive of the Conservatives. Within this, there are divisions by gender. Younger women were 16.5% points more supportive of Labour than young men, and young men were 14.5% points more supportive of the Conservatives than young women. Conversely, older women were 12% points more supportive of the Conservatives than older men, but older men were more than twice as likely to vote for UKIP than older women. Those aged 26-35 looked very similar to those aged under 25, but the gender gap reversed for those aged 36 and above so that women were more supportive of the Conservatives than men.
Current polling thus suggests we can expect the pattern of results in 2017 to look very similar to that in 2015 for men and women. This is perhaps to be expected given the short, two-year window between the elections. Yet the age dynamics in the gender gap in British elections have not historically been consistent between elections. In 2010, young (25 and under) men were more supportive of both Labour and the Conservatives than young women, whilst young women were much more supportive of the Liberal Democrats. In 2005, young men and women differed very little in their degree of support for Labour or the Conservatives, but young men were more supportive of the Liberal Democrats than young women.
This suggests that specific election contexts produce different gender gaps in younger age groups. In the current election, none of the major parties have yet made specific appeals to women voters (contrast this to the ‘Woman to Woman’ battle bus of 2015). The Women’s Equality Party, contesting its first general election, is only fielding candidates in 7 seats. The election is framed to a certain extent – particularly by the Conservatives and the Liberal Democrats – as the ‘Brexit’ election, but polling has suggested that women are less likely to think of Brexit as a key issue in this election compared to men (see here and here for the latest polls on this). Women are more likely to list the NHS, education, health, or welfare as important issues, which might explain Labour’s comparative advantage with young women.
Importantly, though, women are much more likely to say that they don’t know who they are going to vote for than men. In current polls, on average around 10% of men say they don’t know who they are going to vote for; whilst 20%-25% of women say this. As the first section of this post argues, this is unlikely to lead them to be less likely to actually vote. Women have always tended to be more uncertain about their vote intention than men, but still turn out to vote at a similar rate. What’s particularly interesting is that Panelbase shows it is especially women under the age of 55 who are unsure. This could bode either well or ill for Labour: either the undecided women in these age groups will eventually settle for the Labour Party, as many of them did in 2015, or the reason they are undecided is because, although they prioritise the issues that Labour is primarily campaigning on (the NHS, public services), they still don’t see the current Labour Party as a viable option.
The relationship between gender and the vote in this election, as with previous elections, is complex. Women do not tend to vote at lower rates than men in Britain, and at the aggregate level – comparing all men and all women – differences in vote choice between men and women are rather modest. In 2015, overall, there was little difference between men and women in support for Labour whilst women were about 4 points more supportive of the Conservatives. Polls suggest a similar advantage for the Conservatives, but amongst men, in the current election.
However, such headline figures hide substantial gender gaps within age groups, particularly amongst the young. Evidence suggests that Labour is particularly successful amongst young women, but this is also the demographic most undecided about how to vote in the upcoming election. Perhaps this is because this group find it difficult to identify a party to vote for in the current election, characterised by a focus on Brexit, gender-neutral campaigns and a dominant Conservative Party.
This article originally appeared on LSE's British Politics and Policy blog.
Respond


