Dr Aida Garcia-Lazaro is a Research Associate at the University of Bath Institute for Policy Research (IPR). She is also part of the research team at the Centre for People-led Digitalisation.
Digitalisation is transforming all areas of economic activity resulting in firms investing a larger share of intangible capital than in the past. A firm’s equity traditionally depended on physical capital like machinery, equipment and buildings. In the digital age, its equity relies more on intangible investment, which refers to the resources spent on software, the development of new algorithms, branding, new design of products and processes, intellectual property products (IPP) and even personnel training.
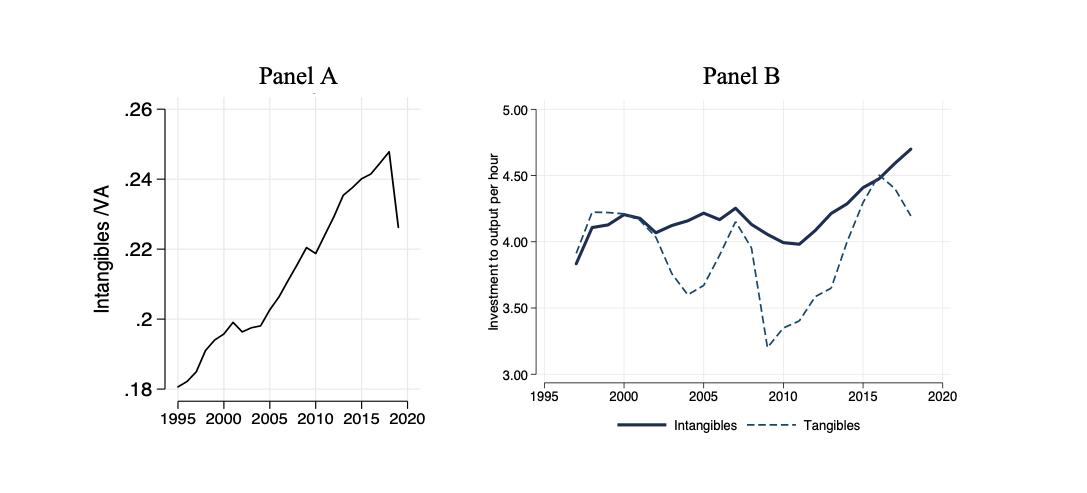
The last decades marked the shift towards intangibles in most OECD economies. Figure 1, panel A shows the upward and steady trend of intangibles to value added in the UK since 1995. The US, Germany, and the Nordic economies face a similar direction on intangibles. Panel B also shows the lower volatility of intangible investment in the UK compared to the sharp swings of tangible assets invested, particularly during crises.
Figure 1. Intangibles in the UK Source: Author’s calculations using EUKLEMS dataset for Panel A and ONS Experimental estimates of investment assets in the UK for Panel B. Intangible investment is divided by output per hour at 2018 prices.
Despite the difficulty of valuing intangibles, Haskel and Westlake (2018) and Corrado et al. (2005, 2009) developed a framework to measure the value of capital stock and investment on intangibles. They classify those into four categories: a) software and databases, b) economic competencies including marketing and branding, organisational capital and employees training, c) other innovative properties including investment on the design of new products and processes and other intellectual property products (OIPP), and d) research and development (R&D).
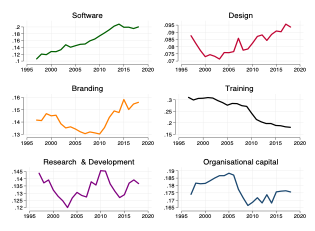
Using experimental data from the ONS to measure intangibles, we find that the share of intangible investment by asset type in total investment has increased since the 1990s for software, design and branding. Figure 2 shows that even before the Covid-19 pandemic, companies invested in their own and purchased software. This intangible also includes adopting digital tools such as data analytics, cloud computing services and digital platforms to improve the efficiency of the distribution points, from which the transport sector has significantly benefited. Other sectors with a large share of intangibles in software are information and communication, professional, scientific and technical services and financial services; to less extent, but still significant, the wholesale retail and trade and the manufacturing sector.
Powerful branding goes beyond a fancy name or logo; it contributes to differentiation from competitors, increasing market share and profitability by building long-lasting relationships with their customers. Resources on branding have been essential for companies like Apple, Coke, Airbnb and Uber to keep on top of the competition. ONS data shows that the UK services are the large investors in branding, mainly wholesale retail and trade, information and communication and financial services. Resources invested in design are concentrated in the manufacturing sector. They likely refer to the design of new machinery and equipment, which turns relevant in light of the 3D printing technology used in the industry.
In contrast, the proportion at which UK companies, on average, invest in training employees dropped by half in 2018, concentrated in a few sectors: transport and the manufacturing sector, professional services and wholesale retail and trade. Investment in R&D is more sector-specific. In 2018 the manufacturing sector invested 45% of its intangibles in R&D but only 12% in software, 13% in design, 11% in branding and 10% in training.
Figure 2. UK intangible investment by asset type
 Source: Author’s calculations using ONS Experimental estimates of investment assets in the UK. Intangible asset investment in total intangible investment at constant prices, 2018.
Beyond the size of the investment, an essential question is whether the increase in intangibles leads to higher productivity, which is, in the end, one of the aims to propel economic growth, wage increase and digital transformation. As is known, the UK has faced a crucial problem of productivity since the global financial crisis, and the disparities across regions and sectors are acute (ONS, 2015).
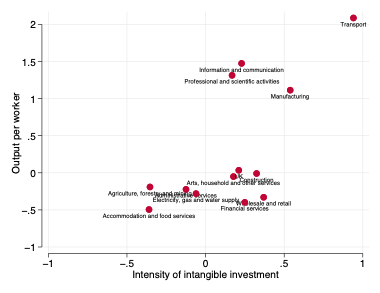
Figure 3 presents the association[1] between the change in investment intensity vs the change in productivity from 2007 to 2018. The investment intensity is the total value of intangibles over output per hour worked. Thus, sectors with larger intensity on intangible investment -a proxy for efficient investment- are those with larger productivity, such as transport, the manufacturing industry, professional and scientific activities, and information and communication. Still, we observe financial services or wholesale retail and trade, which have focused their investment in branding, and organisational capital, and their productivity has yet to take off.
In contrast, the sectors more focused on training, software, and R&D are the ones with a more considerable increase in productivity. Figure 3 shows the complexity of the UK economy; a few sectors are leaders in intangibles and productivity increases, such as transport and manufacturing. However, there are sectors like accommodation and food services or electricity and gas supply for which productivity is even lower than before the global financial crisis, leading to a small but positive change in total UK productivity.
Figure 3.
 Source: Author’s calculations using ONS Experimental estimates of investment assets in the UK. Change in intensity of intangible investment and output per worker from 2007 to 2018.
We argue that in the digital age, intangible assets are an essential ingredient to convey digital transformation. The UK economy has significant room to invest sector-specific and region-specific in these assets. ONS data shows that sectors investing in a combination of intangibles are associated with productivity increases. Future blog entries will expand on this relationship, disaggregating data by intangible type, regions and skills demanded by sectors.
[1] Association, do not confuse with causality.
All articles posted on this blog give the views of the author(s), and not the position of the IPR, nor of the University of Bath.
Respond


