Finding maximum values from arrays
There are times when you may wish to find a maximum, or a minimum, value from a calculation. There are even times when you may wish to match this maximum value to the input value which created it.
For these occasions the use of the numpy functions np.amax and np.argmax are incredibly useful.
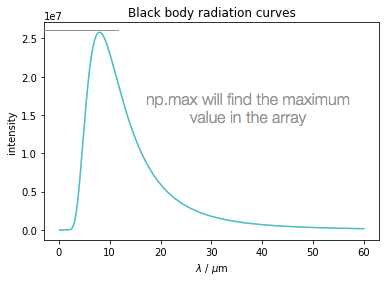
In the attached notebook the blackbody spectrum of a hot cup of tea is calculated and the spectrum plotted using the matplotlib functionality. The maximum value may easily be observed in this case, but so far we have not detailed how we can use functions in python to generate calculated values.
np.amax will find the maximum value in an array. In this case we can run this function agains the output 'calculated' array for intensity.

In this case my calculated array is called intensity363 and so the complete function looks like:
np.amax(intensity363)
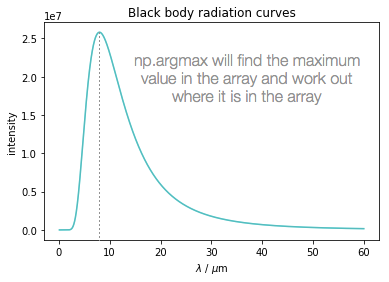
It may also be useful to know at what wavelength this maximum appears:

The function np.argmax will determine which index in the array where the maximum value arises in the intensity363 array, this index value is then matched to the input wavelengths array to find the value of the input which produces this maximum value.
wavelengths[np.argmax(intensity363)]
You can see both of these values calculated in the print statements at the bottom of the first box of code.
Ben has also worked out how to present these values nicely in markdown which is included at the end of the notebooks - this is using the same method of calculating the maxima and minima, but is presenting it as markdown.